-
Each student in a science class of 25 conducts the same experiment. One student gathers all the data from her classmates and summarizes the results of the experiment for the class. She compares the data she personally recorded with the class data. Which of these might indicate to her that her results are valid?
- Three other classes performed the same experiment.
- The same experiment was repeated two years in a row.
- Many other students recorded data similar to hers.
- Another student in her class reached a different conclusion.
-

Which animal has a life span closest to that of sheep?- Dog
- Cat
- Horse
-
Cow
-
 Crickets chirp to attract other crickets. The temperatures and rates of their chirping are graphed above. Which statement below is most likely true for the data represented in the graph?
- The cooler the temperature, the louder the crickets chirp.
- The crickets cannot chirp at temperatures lower than 10 degrees C.
- The warmer the temperature, the more often crickets chirp.
-
The temperature and the chirping of crickets are not related.
-

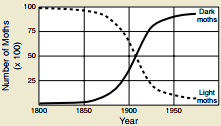
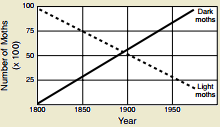
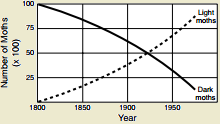
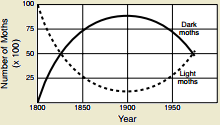
Scientists have spent many years studying the peppered moth, which is a species that has adapted its color from light to dark in reaction to environmental pollution. Which of the following line graphs represents the data from the table? -
-
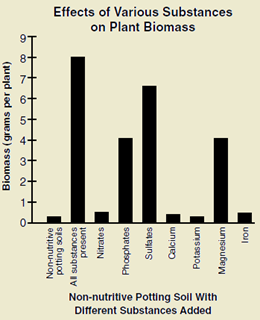 According to this graph, which of these is most important in developing the biomass of these plants?
- Nitrates
- Sulfates
- Magnesium
-
Iron
-
 The line graph shows the heights of plants grown in fertilized and unfertilized soil. Based on this information, what will most likely occur on day six?
 - Neither plant should increase by 1 cm in height.
- Plant A should increase about 1 cm in height.
- Plant B should increase about 1 cm in height.
-
Plant A should increase about 2 cm in height.
-

The line graph shows five years of data about a dog. What information does the graph show?- How the mass of the dog changed
- How much food the dog consumed
- What kinds of food the dog consumed
- When the dog was measured each month
-
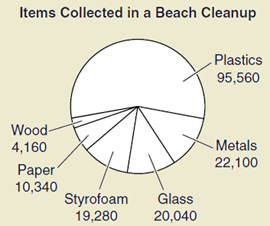 (2004) This chart represents the type and number of items collected in a beach cleanup. Based on the above chart, what percentage of the total items collected from the beaches was plastic?
- 46%
- 49%
- 56%
- 70%
-
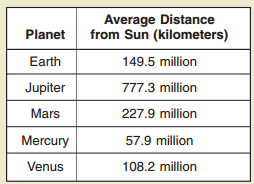 According to this chart, which planet will most likely have the highest temperatures?
- Earth
- Mars
- Mercury
- Venus
-
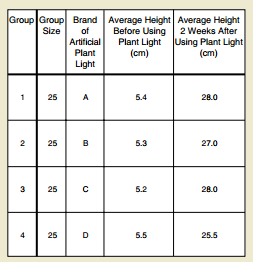 The chart shows the results of an experiment to test the effects of different plant lights on plant seedling growth. Which group of plants showed the greatest gain in height?
- Group 1
- Group 2
- Group 3
-
Group 4
-

According to the graph, which air pollutant decreased the most from 1970 to 1991?- Carbon monoxide
- Sulfur oxides
- Particulates
-
Lead
-

A scale model of the planet Mercury is shown. Based on the scale, which of the following is the most accurate diameter of Mercury?- 1,000 km
- 5,000 km
- 50,000 km
- 500,000 km
-
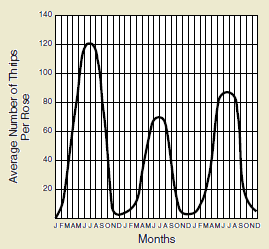
Thrips are tiny insects that can easily be seen on roses. The thrip population changes shown in the graph above are probably caused by —- increases in human population
- a major climatic change
- seasonal changes
- increased use of insecticides
-

How far offshore is the deepest point of the ocean on this graph?- 0 m
- 5000 m
- 160 km
- 240 km
-

This data table shows the results of an investigation. What information should be used for the column headings marked X?- Trial number
- Number of seeds
- Predicted value for the results
- Average of the data in each column
-

From the data given in this table, which characteristics help classify the seashells as belonging to the Tellin family?- Color, size, and hinge type
- Color, size, and water temperature
- Hinge type, location, and water temperature
- Size, hinge type, and location
-
 What is the mass of the rock?
- 335.6 g
- 350.6 g
- 354.6 g
-
356.0 g
-
The density of an object is dependent upon the objectís mass and ó
- height
- area
- volume
- weight
-
 The picture shows the results of putting a drop of orange ink from a marking pen on a piece of filter paper and allowing the colors in the ink to separate. About how much farther on the filter paper has the yellow pigment moved than the red pigment?
- 0.5 cm
- 1.6 cm
- 2.7 cm
- 3.5 cm
-

To complete a project, 200,000 Joules of work are needed. The time taken to complete the project is 20 seconds. How much power is needed?- 0.0001 J/s
- 10,000 J/s
- 200,020 J/s
- 1,000,000 J/s
